Below you will find projected finish times for each of Mocorunning's ranked runners as of Week 6 (10/13/2019). Scroll to the bottom to read how the projected times were determined.
Projected County Championship 5k Times
========================================================================================================
Pl	Name			School			Year		Projected Time	Points
========================================================================================================
1	Garrett Suhr		Richard Montgomery	2020		15:48.4		1
2	Ayu Fantaw		Northwood		2020		15:59.1		2
3	Surafel Mengist		Springbrook		2020		16:05.1		3
4	Tamrat Snyder		Damascus		2020		16:06.0		4
5	Jacob Marks		Walter Johnson		2020		16:08.9		5
6	Tsach Mackey		Churchill		2021		16:15.0		6
7	Henok Eshetu		Northwood		2020		16:15.2		7
8	Sean Enright		Sherwood		2020		16:16.3		8
9	Timothy Boyce		Northwood		2021		16:16.4		9
10	Aidan Goldenberg-Hart	Richard Montgomery	2020		16:21.3		10
11	Elias Applebaum		Richard Montgomery	2021		16:24.0		11
12	Lamine Fofana		Northwood		2020		16:28.2		12
13	Andrew Schell		Walter Johnson		2022		16:28.5		13
14	Levi Bryant		Einstein		2021		16:30.0		14
15	Gabriel Worthington	Blair			2020		16:31.0		15
16	Natnel Tiroro		Wheaton			2020		16:31.3		16
17	Jack Anderson		Sherwood		2021		16:37.1		17
18	Seth Bangser		Walter Johnson		2020		16:38.6		18
19	Joel Simpson		Blair			2021		16:39.2		19
20	Alex Scott		Walter Johnson		2021		16:39.5		20
21	Jake McCarty		B-CC			2021		16:44.4		21
22	Jackson Megary		Whitman			2022		16:48.1		22
23	Sam Eig			Clarksburg		2020		16:50.8		23
24	Esrom Weldegiorgis	Blair			2020		16:52.9		24
25	Lamar Wilson		Northwood		2022		16:54.2		25
26	Henry Kaye		Richard Montgomery	2022		16:55.9		26
27	Gage Osborne		Northwest		2023		16:56.1		27
28	Sam Bodmer		Poolesville		2020		16:56.3		28
29	Adam Morad		Walter Johnson		2021		16:56.4		29
30	Ryan Temple		Blair			2020		16:57.0		30
31	Edward Lyness		Blair			2022		16:58.9		31
32	Tinoda Matsatsa		Northwest		2022		16:59.8		32
33	Andrew Misura		Churchill		2020		17:02.3		33
34	Chris Stallard		Poolesville		2021		17:02.9		34
35	Eric Gomez		Springbrook		2022		17:03.0		35
36	Jose Ramirez		Gaithersburg		2020		17:03.2		36
37	Sadou Sow		Gaithersburg		2022		17:03.9		37
38	Henry Burd		Churchill		2022		17:05.4		38
39	Joseph DeJong Franklin	Wootton			2020		17:06.1		39
40	Yabsira Gugsa		Paint Branch		2020		17:07.8		40
41	Lucas Corea		Richard Montgomery	2022		17:07.8		41
42	Caden DeValle		Damascus		2021		17:07.9		42
43	Yosef Tsigie		Paint Branch		2021		17:10.0		43
44	Ian Gormley		Sherwood		2020		17:10.6		44
45	Jason Wang		Wootton			2022		17:11.5		45
46	Lewis Sisler		B-CC			2021		17:11.8		46
47	Justin Hayes-Puttfarcken Sherwood		2021		17:11.8		47
48	Jeriel Williams		Springbrook		2022		17:12.2		48
49	William Mason		Richard Montgomery	2022		17:12.8		49
50	Vipulan Scot Sritharan	Wootton			2020		17:12.8		50
51	Roger Arias		Northwest		2021		17:13.4		51
52	James Friebert		B-CC			2020		17:14.1		52
53	Gregory Garner		Whitman			2021		17:14.7		53
54	Eamon Plante		Sherwood		2020		17:15.7		54
55	Andualem Amado		Richard Montgomery	2021		17:16.0		55
56	Samuel Wank		Churchill		2021		17:16.5		56
57	Nicholas Olano		Richard Montgomery	2020		17:16.7
58	Julien Higgins		Churchill		2022		17:16.8		57
59	Stefan Ney		Northwest		2020		17:17.2		58
60	Joey Caiazza-Blum	B-CC			2020		17:18.1		59
61	Jonathan Fontek		Quince Orchard		2020		17:20.3		60
62	Colin Patil		Sherwood		2021		17:21.1		61
63	Brandon Lang		Churchill		2022		17:22.7		62
64	Jeremy Simon		B-CC			2022		17:23.1		63
65	Yarhiv Simhony		Walter Johnson		2022		17:23.4		64
66	Benjamin Lesser		Whitman			2020		17:23.7		65
67	Max Worley		Blair			2020		17:24.8		66
68	Armaan Salckak		Wootton			2022		17:25.0		67
69	Daniel Nusraty		Churchill		2021		17:26.0		68
70	Sohan Ganatra		Clarksburg		2020		17:26.0		69
71	Noam Tuckman		Sherwood		2022		17:27.9		70
72	Nathaniel Gray		Walter Johnson		2020		17:27.9		71
73	Mark Cunniff		Whitman			2022		17:30.1		72

Projected Team Scores (5 or more ranked runners)
=================================================
1. Northwood		55
2. Walter Johnson	85
3. Richard Montgomery	89
4. Blair		119
5. Sherwood		170
6. Churchill		190
7. B-CC			241

Four Ranked Runners: Northwest, Whitman, Wootton
Mocorunning's ranking formula is explained HERE. The ranking formula compares runners in every race throughout the season and year after year. The finish times only matter to the extent that finish times of all ranked runners will be compared and scored against all other ranked runners in that race. There is no reward for running "fast times" at a course in North Carolina that no one else traveled to. Likewise, there is no penalty for running "slow times." In other words there is absolutely no benefit to running a fast course like the Great American course compared to a difficult course like Hereford. The most important thing for mobility within the ranking is beating other ranked runners by as many seconds as possible.
The projections you see on this page exactly match the names on the week 6 ranking published on 10/13/2019 with a couple notable changes. Private school runners were removed and the points were replaced with projected finish times for the county championship course at Gaithersburg. Do the points convert directly to 5k times? No, not exactly, but the points do convert to a time scale. 1 second = 2 points. Therefore, if the top ranked runner had 200 points, he or she would be ranked 200 points or 100 seconds above the cutoff to make the ranking. You can assign that top ranked runner any 5k time, and he or she would be 100 seconds (1:40) above the cutoff to make the ranking. Take any two runners and subtract their point totals, divide by two, and you will know how far apart they are supposed to finish according to the ranking.
To assign the projected times to all the runners, you really only need to assign a projected time to one runner. Once one runner has an assigned projected time, the point scale dictates the finish times for every other runner within the ranking. It's not the first or last ranked runner that you want to key off of. It's the runners in the middle range that will be the most consistent year after year. The great thing about the county championship is that we have the same exact number of teams entered in the meet at the same time of the year, every year. The caliber of the middle tier varsity runners will not fluctuate very much from year to year. Weather is also a factor, and we saw that impact last year's championship meet in a big way. More on that in a second.
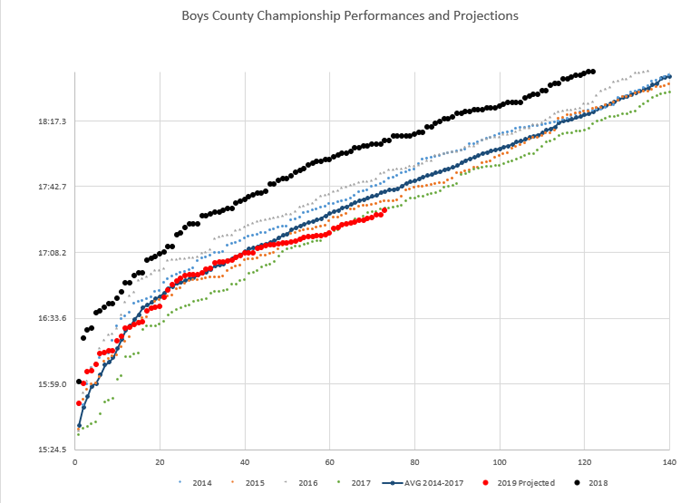
The chart below shows the county championship varsity race plotted for each of the last five years plus a line showing the average finish times for 2014 to 2017. It should jump out at you immediately the black dots representing finish times from 2018. You can see immediately how much slower last year was compared to the previous four years. The explanation is simple: It rained all season, it rained in the days leading up to the meet, and it rained during the meet. All other years were dry and ideal conditions. We are expected to get some rain on Wednesday but otherwise it should be another ideal weather day for the 2019 county championship. In projecting times for 2019, I threw out 2018 as an anomoly not expected to repeat.
Under the assumption that 2019 will be an average year, meaning that this year's top 100 varsity high school runners are no better or worse than a typical year, I want my RED projected dots to land on the blue AVG line as closely as possible. I cannot manipulate the curvature of the red line. The curvature of the red line is dictated by the ranking/points system. I can only move my red line up or down vertically which I did until I felt that I had the best overlay. I did not look at the first ranked runner. I aimed to line up the 20th to 40th ranked runners as closely as possible to the average 20th to 40th place runners from 2014 to 2017. Doing this exercise ensured that the projections are in line with the history of the meet on this course.
Name
Comments
Wut
Tuesday, October 15, 2019 06:25:25 PM
No just no
Wut
Tuesday, October 15, 2019 06:47:08 PM
While I understand the point of trying to make the 20-40 runners typical I think it’s problematic that very few of these guys are predicted to SR or PR.
Kevin
Tuesday, October 15, 2019 07:12:17 PM
Of the 36 ranked boys who ran in perfect conditions at WakeMed Park this year, most will not PR at the county championship.
I’m number 4
Wednesday, October 16, 2019 04:08:22 PM
So I’m only going to run 4 seconds faster than I did a week ago don’t do that
Let's not jump to conclusions
Wednesday, October 16, 2019 08:28:29 PM
This year is really fast, it could still break the curve, but the curve exists for a reason
Wut
Wednesday, October 16, 2019 11:09:42 PM
I can conclude that more than 2 people will break 16 and that Garrett Suhr will run faster than 15:48