|
Below you will find projected finish times for each of Mocorunning's ranked runners as of Week 7 (10/15/2023). Scroll to the bottom to read how the projected times were determined.
Projected County Championship 5k Times
========================================================================================================
Pl        Name                  School                      Year            Projected Time      Points
========================================================================================================
 1	Katherine Morey		Winston Churchill	    2027	    18:26.8		 1
 2	Grace Finnegan		Richard Montgomery	    2024	    18:56.1		 2
 3	MacKenzie Raue		Walter Johnson		    2024	    19:11.1		 3
 4	Megan Raue		Walter Johnson		    2025	    19:27.1		 4
 5	Victoria Ketzler	Thomas S. Wootton	    2024	    19:35.5		 5
 6	Ani Bailin		Bethesda Chevy Chase	    2025	    19:37.4		 6
 7	Madeleine Simmons	Walter Johnson		    2025	    19:37.5		 7
 8	Emilie Creighton	James H. Blake		    2025	    19:39.5		 8
 9	Sophie Harjes		Bethesda Chevy Chase	    2025	    19:45.9		 9
10	Carolyn Hultman		Walter Johnson		    2024	    19:59.4		10
11	Ella Werkman		Walt Whitman		    2025	    20:05.3		11
12	Katie Greenwald		Walt Whitman		    2025	    20:10.0		12
13	Roma Diak		Poolesville		    2025	    20:10.1		13
14	Charlotte Chang		Thomas S. Wootton	    2026	    20:11.8		14
15	Madeline Quirion	Sherwood		    2026	    20:16.8		15
16	Mirae Dinaro		Walter Johnson		    2027	    20:17.3		16
17	Audrey Wychulis		Northwest		    2026	    20:18.1		17
18	Maryn Murray		John F. Kennedy		    2024	    20:18.3		18
19	Ingrid Sullivan		Montgomery Blair	    2027	    20:33.8		19
20	Noor Aly		Winston Churchill	    2025	    20:43.6		20
21	Nya Stoian		Bethesda Chevy Chase	    2027	    20:46.9		21
22	Adelaide Keller		Richard Montgomery	    2027	    20:50.0		22
23	Aubrey Green		Bethesda Chevy Chase	    2026	    20:50.8		23
24	Morgan Kirsch		Bethesda Chevy Chase	    2025	    20:52.6		24
25	Lauren Gotting		Richard Montgomery	    2025	    20:53.6		25
26	Korinne Austin		Winston Churchill	    2026	    20:53.7		26
27	Lilah Rich		Bethesda Chevy Chase	    2026	    20:55.2		27
28	Emilia Pardo		Winston Churchill	    2027	    20:55.2		28
29	Ava Summerfield		Bethesda Chevy Chase	    2027	    20:55.8		29
30	Aanya Tiwari		Thomas S. Wootton	    2025	    20:56.0		30
31	Ruby Mercer		Poolesville		    2026	    20:56.4		31
32	Erica Millin		Poolesville		    2027	    21:03.0		32
33	Elizabeth Finn		Walter Johnson		    2025	    21:03.0		33
34	Lexis Owens		Damascus		    2025	    21:05.3		34
35	Elizabeth Fogg		Walter Johnson		    2024	    21:06.5		35
36	Danielle Krin		Bethesda Chevy Chase	    2025	    21:07.8
37	Zuzana Huserova		Walter Johnson		    2024	    21:10.3
38	Maria Caballero		Walt Whitman		    2027	    21:13.4		36
39	Julia Robison		Montgomery Blair	    2025	    21:13.7		37
40	Annie Sun		Thomas S. Wootton	    2025	    21:15.6		38
41	Sophia Barrett		Walter Johnson		    2026	    21:19.6
42	Ava Wagner		Poolesville		    2024	    21:20.6		39
43	Natalie Merberg		Walter Johnson		    2024	    21:22.3
44	Caroline Zuba		Winston Churchill	    2024	    21:25.0		40
45	Olivia Woitach		Walt Whitman		    2025	    21:26.0		41
46	Opal Siegal		Winston Churchill	    2027	    21:26.3		42
47	Josephine Swagart	Rockville		    2024	    21:27.3		43
48	Katja Treadwell		Walt Whitman		    2026	    21:30.3		44
49	Margaret Sagan		Winston Churchill	    2026	    21:30.9		45
50	Aimee Tukey		Winston Churchill	    2025	    21:31.4
51	Adelaide Ryan		Gaithersburg		    2027	    21:35.9		46
52	Layla Swyndle		Poolesville		    2027	    21:38.4		47
53	Audrey Inglese		Richard Montgomery	    2025	    21:38.8		48


Projected Team Scores (Teams with 5+ ranked runners)
=================================================
   School                       Projected Points
=================================================
1. Walter Johnson			 40
2. Bethesda Chevy Chase                  83
3. Winston Churchill                    115
4. Walt Whitman                         144
5. Poolesville				162

Teams with Four Ranked Runners: Wootton, Richard Montgomery
Mocorunning's ranking formula is explained HERE. The ranking formula compares runners in every race throughout the season and year after year. The finish times only matter to the extent that finish times of all ranked runners will be compared and scored against all other ranked runners in that race. The most important thing for mobility within the ranking is beating other ranked runners by as many seconds as possible.
The projections you see on this page exactly match the names on the week 7 ranking published on 10/15/2023 with a couple notable changes. Private school runners were removed and the points were replaced with projected finish times for the county championship course at Gaithersburg. Do the points convert directly to 5k times? No, not exactly, but the points do convert to a time scale. 1 second = 2 points. Therefore, if the top ranked runner had 200 points, he or she would be ranked 200 points or 100 seconds above the ranking cutoff. You can assign that top ranked runner any 5k time, and he or she would be 100 seconds (1:40) above the ranking cutoff. Take any two runners and subtract their point totals, divide by two, and you will know how far apart they are expected to finish according to the ranking.
To assign the projected times to all the runners, you really only need to assign a projected time to one runner. Once one runner has an assigned projected time, the point scale dictates the finish times for every other runner within the ranking.
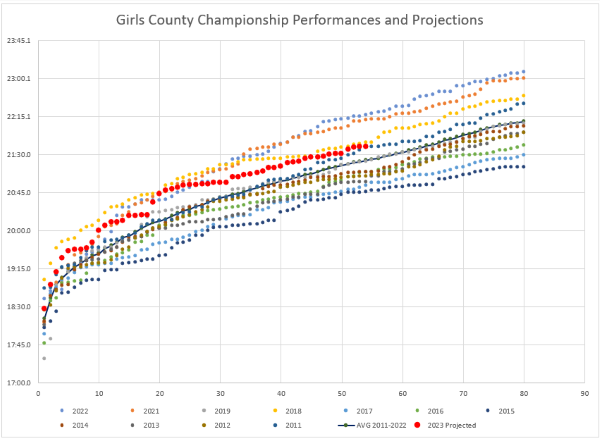
This is where I usually make the case that this will be an average year with average varsity runners: average runners will fall in line with the Montgomery County Championship course average trend line. Man, was that wrong the last couple years. In 2021, I chalked it up to wet course conditions. In 2022, conditions were fantastic, yet both the boys and girls races were statistically among the slowest in venue history. My belief is that we were not back to "average" in 2022 after COVID-19 changed the world. Now I am faced with the question: are we back to "average" in 2023?
When I lined up this year's ranking with the trend line of average performances from 2011 to 2022, it projected a personal record for almost every girl in the race by 20-to-30 seconds. It projected a personal record for almost every boy in the race by 10-to-20 seconds. The county meet is fast, but it's not that fast.
I have been putting out an article like this for a lot of years, usually following the same methodology: I lined up the ranking with the trend line of average performances on this course. After over-projecting finish times by so much the last two years, I am changing things up. Instead of following the identical methodology, I am splitting the difference between 2022 and the historical average trend line. For girls, that means 18 seconds slower than the historical average. For boys, it means 7 seconds slower than the historical average. This predicts that the strength and depth of the county's varsity runners in 2023 will be stronger than in 2021 and 2022, but not yet back to the historical average since 2011. In doing a sanity check, this puts a lot of runners who have not run fast courses yet this year right around their SR or a little faster. Runners who have run fast 5k courses may be projected to be a little slower than their SR. That is probably about right for the county course.
The curvature of the red dot curve is dictated by the ranking system. I can only move the red trend line up or down vertically to match the historical results profile of the county championship meet. I aimed to line up the 10th to 40th ranked runners so it split the difference between the 2022 trend line and the historical average trend line.
Lastly, I want to point out that the lowest point total for girls teams in the era of 25 high schools is 45 points by the 2010 Whitman girls. The lowest point total in meet history was 27 points by the Walter Johnson girls in 1999 when there were 23 high schools. The latter may not be in jeopardy, but the former is on high alert.
 |
