|
Below you will find projected finish times for each of Mocorunning's ranked runners as of Week 6 (10/13/2024). Scroll to the bottom to read how the projected times were determined.
Girls Projected County Championship 5k Times
========================================================================================
Pl Name                  	School                  Year           Projected Time
========================================================================================
1  Katherine Morey		Winston Churchill	2027		18:07.1
2  Ani Bailin			Bethesda Chevy Chase	2025		18:34.9
3  Emma Colavito		Richard Montgomery	2025		18:40.5
4  Megan Raue			Walter Johnson		2025		19:03.4
5  Madeline Quirion		Sherwood		2026		19:05.2
6  Katie Greenwald		Walt Whitman		2025		19:10.6
7  Mirae Denaro			Walter Johnson		2027		19:11.1
8  Julia Robison		Montgomery Blair	2025		19:20.4
9  Roma Diak			Poolesville		2025		19:21.5
10 Ella Werkman			Walt Whitman		2025		19:24.1
11 Emilie Creighton		James H. Blake		2025		19:24.4
12 Nya Stoian			Bethesda Chevy Chase	2027		19:26.6
13 Celestine Delannay		Bethesda Chevy Chase	2026		19:35.0
14 Audrey Wychulis		Northwest		2026		19:35.8
15 Charlotte Chang		Thomas S. Wootton	2026		19:37.1
16 Whitney Duhon		Northwest		2025		19:38.4
17 Madeline Kelly		Clarksburg		2027		19:45.1
18 Sophie Harjes		Bethesda Chevy Chase	2025		19:48.8
19 Korinne Austin		Winston Churchill	2026		19:57.7
20 Madeleine Simmons		Walter Johnson		2025		20:07.5
21 Zia Elam			Poolesville		2025		20:31.1
22 Adelaide Keller		Richard Montgomery	2027		20:32.4
23 Nadia Lund			Winston Churchill	2028		20:33.1
24 Margaret Sagan		Winston Churchill	2026		20:35.0
25 Lilah Rich			Bethesda Chevy Chase	2026		20:35.6
26 Lucy Holland			Montgomery Blair	2026		20:37.5
27 Natalie McCarty		Walter Johnson		2028		20:42.5
28 Adelaide Ryan		Gaithersburg		2027		20:50.3
29 Aubrey Green			Bethesda Chevy Chase	2026		20:52.0
30 Gabriella Janss		Damascus		2025		20:52.0
31 Noor Aly			Winston Churchill	2025		20:52.0
32 Alexia Ladstaetter		Bethesda Chevy Chase	2026		20:54.9
33 Sifen Tusse			James H. Blake		2026		21:00.7
34 Annie Sun			Thomas S. Wootton	2025		21:01.5
35 Mariana Song			Bethesda Chevy Chase	2028		21:03.8
36 Marcela Mason-Rodriguez	Montgomery Blair	2027		21:04.4
37 Emma Bergfalk		Montgomery Blair	2025		21:06.4
38 Ruby Mercer			Poolesville		2026		21:06.5
39 Elizabeth Finn		Walter Johnson		2025		21:08.0
40 Aimee Tukey			Winston Churchill	2025		21:10.9
41 Ann Linke			Walter Johnson		2026		21:12.2
42 Annabel Kotek		Walter Johnson		2026		21:12.5
43 Ariana Arturo		Rockville		2026		21:15.4
44 Shreya Modur			Northwest		2026		21:17.1
45 Lauren Gotting		Richard Montgomery	2025		21:19.1
46 Emilia Pardo			Winston Churchill	2027		21:19.3
47 Emily Wychulis		Northwest		2028		21:19.4
48 Clara Dixon			Albert Einstein		2027		21:20.5
49 Erica Millin			Poolesville		2027		21:21.0
50 Bonita Eckford		Walt Whitman		2028		21:24.8
51 Anna McCrae			Poolesville		2026		21:26.1
52 Lexis Owens			Damascus		2025		21:26.8
53 Emerson Bernstein		Winston Churchill	2025		21:27.8

Projected Team Scores (Teams with 5+ ranked runners)
=================================================
   School                       Projected Points
=================================================
1. Bethesda Chevy Chase			70
2. Walter Johnson			96
3. Winston Churchill			98
4. Poolesville				165
Teams with Four Ranked Runners: Blair, Northwest
Teams with Three Ranked Runners: Richard Montgomery, Whitman
Mocorunning's ranking formula is explained HERE. The ranking formula is a system of point stealing. Points are stolen by finishing closer to or further ahead of other ranked runners compared to what is "expected." It is an interesting alternative to stagnant rankings of season best 5k times. Every race counts. Every race is an opportunity to perform better than expected relative to other ranked runners.
The projections you see on this page exactly match the names on the week 6 ranking published on 10/13/2024 with a couple notable changes. Private school runners were removed and the points were replaced with projected finish times for the county championship course at Gaithersburg. Do the points convert directly to 5k times? No, not exactly, but the points do convert to a time scale. 1 second = 2 points. Therefore, if the top ranked runner had 200 points, he or she would be ranked 200 points or 100 seconds above the ranking cutoff. You can assign that top ranked runner any 5k time, and he or she would be 100 seconds (1:40) above the ranking cutoff. Take any two runners and subtract their point totals, divide by two, and you will know how far apart they are expected to finish according to the ranking.
To assign the projected times to all the runners, you really only need to assign a projected time to one runner. Once one runner has an assigned projected time, the point scale dictates the finish times for every other runner within the ranking. It is not the first or last ranked runner that you want to key off of. It is the runners in the middle range that will be the most consistent year after year. The great thing about the county championship is that we have the same exact number of teams entered in the meet at the same time of the year, every year. The caliber of the middle tier varsity runners will not fluctuate very much from year to year.
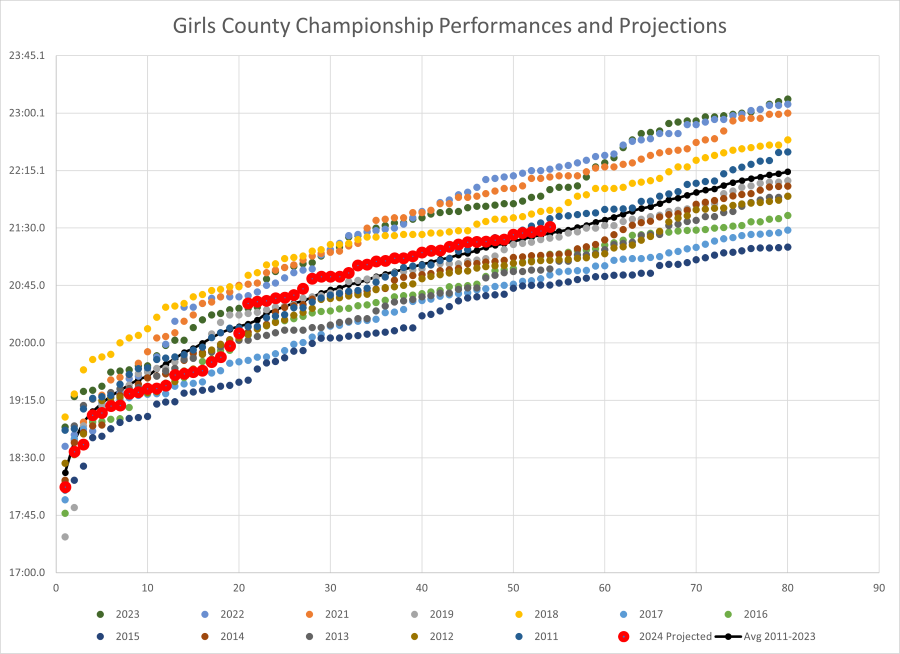
The chart below shows the county championship varsity race finishers plotted for each year since the course was modified in 2011. With twelve years of history on the course, the average line is well-defined. You can see that there have been some slow years (2018, 2021, 2022, 2023) and some very fast years (2015 and 2017). Weather played a roll in 2018 and 2021 when the course was particularly wet. Most other years have been dry, and the athletes dictated the speed of the course. The pandemic clearly affected the depth of the varsity race since 2021.
Last year, I made an adjustment to the projections for the reason that the sport was suffering a lack of depth since the pandemic. That proved to be wise. With the boys this year, I chose to go back to calling this an average year. With the girls, a large gap in the middle of the ranking made that difficult.
This is usually where I preach that in an average year, I aim to line up the #20 to #40 runners with the historical average trend line. The girls ranking has an unusual quirk this year. The ranking shows a 42 second spread between the #18 and #21 ranked runners. It is a 24 second gap between the #20 and #21 runners I could not line up the #20 to #40 ranked runners with the historical average line and still have reasonable projections for the top 20. When I lined up the #21-40 with the historical average, the top 20 runners projected significantly below the course average line. That hypothetical case made the projections unrealistically fast. I did not want to go there. Instead, I aimed to line up the #1 through #20 close to the historic average line while every runner #21 through #54 is above the average line. That choice is in line with my assertion that the county's overall depth still has not recovered to pre-Pandemic levels. The projections you see here for 2024 are still faster than the actual performances from 2021, 2022, and 2023.
 |
