|
Below you will find projected finish times for each of Mocorunning's ranked runners as of Week 6 (10/13/2024). Scroll to the bottom to read how the projected times were determined.
Boys Projected County Championship 5k Times
========================================================================================
Pl Name                  	School                  Year           Projected Time
========================================================================================
1  Nathaniel Swanson		Winston Churchill	2025		15:58.9
2  Edward Sun			Thomas S. Wootton	2025		16:05.0
3  Mateo Gros-Slovinsky		Walt Whitman		2025		16:06.5
4  Henry Nichols		Northwood		2026		16:11.0
5  Rendon Yerman		Thomas S. Wootton	2025		16:19.0
6  Semir Kemal			James H. Blake		2025		16:21.3
7  Santiago Gutierrez		Winston Churchill	2026		16:23.5
8  Ayaan Ahmad			Clarksburg		2026		16:25.2
9  Griffin Lupes		Albert Einstein		2025		16:27.6
10 Cadan Felten			Bethesda Chevy Chase	2025		16:28.6
11 Connor Kohne			Poolesville		2025		16:32.2
12 Nathan Downie		Thomas S. Wootton	2026		16:37.4
13 Luke Gabrielle		Thomas S. Wootton	2026		16:38.0
14 Zachary Oh			James H. Blake		2027		16:38.7
15 Naasir Bakari		Northwest		2025		16:44.2
16 Erich Ramos			Montgomery Blair	2026		16:45.8
17 Stepan Volkov		Winston Churchill	2025		16:47.2
18 Donovan Hicks		Bethesda Chevy Chase	2026		16:47.5
19 Jefferson Regitz		Rockville		2025		16:49.6
20 Sam Buxton			Albert Einstein		2025		16:51.7
21 Adam Kronenberg		Northwest		2025		16:54.3
22 Dimitrios Rementelas		Sherwood		2028		16:55.4
23 Ethan Dimmerling		Poolesville		2027		16:59.1
24 Ian Fisher			Northwood		2028		17:00.1
25 Daniel Skendaj		Bethesda Chevy Chase	2026		17:00.4
26 Evan Blenkinsop		Montgomery Blair	2026		17:00.9
27 Grant Levens			Walter Johnson		2026		17:04.4
28 Ellis Eppard			Thomas S. Wootton	2025		17:04.6
29 Peter Lanpher		Bethesda Chevy Chase	2026		17:05.5
30 Benjamin Ploeger		Wheaton			2026		17:05.5
31 Satchel Jelen		Montgomery Blair	2026		17:08.0
32 Luke Burkes			Albert Einstein		2026		17:08.1
33 John Taylor 			Montgomery Blair	2026		17:08.6
34 Jasper Goldstein		Walter Johnson		2025		17:09.5
35 Carter Zembrzuski		Richard Montgomery	2025		17:11.8
36 Arin	Joshi 			Walt Whitman		2027		17:12.7
37 Jonah Greszler		Walt Whitman		2027		17:14.8
38 Jacob Martin			Paint Branch		2025		17:15.1
39 Garrett Simons		Poolesville		2026		17:16.0
40 Daniel McNelis		Winston Churchill	2026		17:16.0
41 Maxwell Wolf			Walt Whitman		2026		17:16.6
42 Ioannis Rementelas		Sherwood		2028		17:16.8
43 Dylan Underwood		Clarksburg		2025		17:17.8
44 Jonah Daniel			Walter Johnson		2025		17:18.0
45 Cleveland Wall		Magruder		2025		17:18.0
46 Ari Held			Northwood		2027		17:18.2
47 Olin Hogentogler		Sherwood		2025		17:18.4
48 Stuart Mallon		Montgomery Blair	2026		17:20.3
49 Tyler Gottesman		Damascus		2025		17:20.6
50 Andrew Klein			Damascus		2025		17:21.1
51 Tobin Connelly		Bethesda Chevy Chase	2026		17:21.2
52 Richard Harris		Northwest		2027		17:21.3
53 Zack Pritts			Walt Whitman		2026		17:23.0
54 Cherian Mampilly		Bethesda Chevy Chase	2025		17:23.0
55 Kylen Tow			Richard Montgomery	2025		17:23.0
56 Luca Servis			Rockville		2026		17:23.0
57 Jack Kreindler		Winston Churchill	2026		17:23.1
58 Alex Zirkelbach		Sherwood		2028		17:23.5
59 Braeden Taylor		Rockville		2027		17:23.6
60 Benjamin Burckle		Montgomery Blair	2026		17:23.9
61 Nicolas Tamez		Walt Whitman		2025		17:27.0
62 Oliver Sykora		Sherwood		2025		17:28.0
63 Caleb Charmatz		Sherwood		2027		17:29.0
64 Keaton Trouteaud		Poolesville		2026		17:29.0
65 Alexander Hofmann		Sherwood		2025		17:29.0
66 Krish Sood			Winston Churchill	2028		17:31.5
67 Aiden Liu			Montgomery Blair	2026		17:33.7

Projected Team Scores (Teams with 5+ ranked runners)
=================================================
   School                       Projected Points
=================================================
1. Thomas S. Wootton			60
2. Winston Churchill			122
3. Bethesda Chevy Chase			133
4. Montgomery Blair			154
5. Walt Whitman				170
6. Sherwood				231
Teams with Four Ranked Runners: Poolesville
Teams with Three Ranked Runners: Einstein, Northwest, Northwood, Rockville, Walter Johnson
Mocorunning's ranking formula is explained HERE. The ranking formula is a system of point stealing. Points are stolen by finishing closer to or further ahead of other ranked runners compared to what is "expected." It is an interesting alternative to stagnant rankings of season best 5k times. Every race counts. Every race is an opportunity to perform better than expected relative to other ranked runners.
The projections you see on this page exactly match the names on the week 6 ranking published on 10/13/2024 with a couple notable changes. Private school runners were removed and the points were replaced with projected finish times for the county championship course at Gaithersburg. Do the points convert directly to 5k times? No, not exactly, but the points do convert to a time scale. 1 second = 2 points. Therefore, if the top ranked runner had 200 points, he or she would be ranked 200 points or 100 seconds above the ranking cutoff. You can assign that top ranked runner any 5k time, and he or she would be 100 seconds (1:40) above the ranking cutoff. Take any two runners and subtract their point totals, divide by two, and you will know how far apart they are expected to finish according to the ranking.
To assign the projected times to all the runners, you really only need to assign a projected time to one runner. Once one runner has an assigned projected time, the point scale dictates the finish times for every other runner within the ranking. It is not the first or last ranked runner that you want to key off of. It is the runners in the middle range that will be the most consistent year after year. The great thing about the county championship is that we have the same exact number of teams entered in the meet at the same time of the year, every year. The caliber of the middle tier varsity runners will not fluctuate very much from year to year.
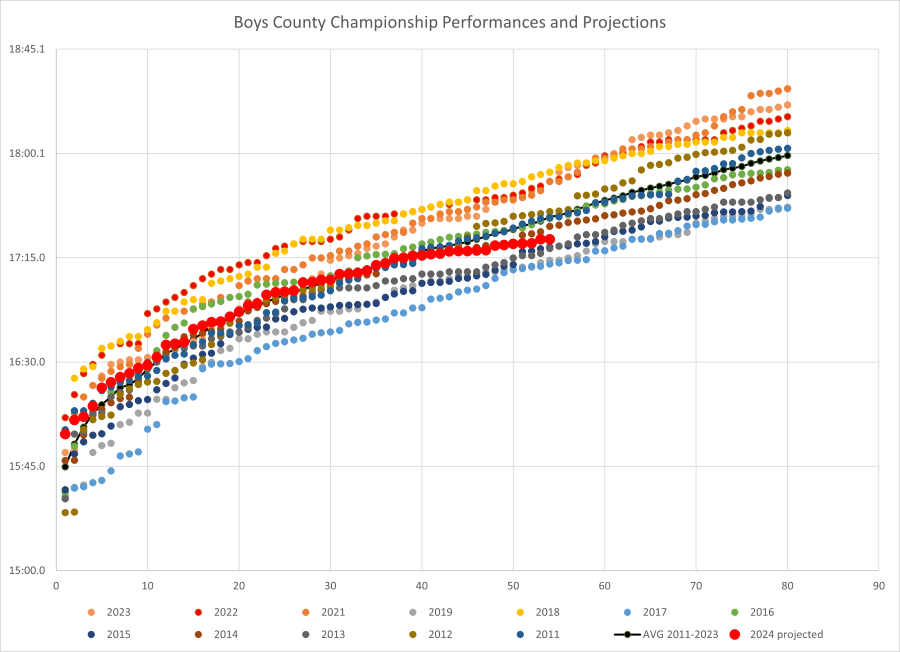
The chart below shows the county championship varsity race finishers plotted for each year since the course was modified in 2011. With twelve years of history on the course, the average line is well-defined. You can see that there have been some slow years (2018, 2021, 2022, 2023) and some very fast years (2015 and 2017). Weather played a roll in 2018 and 2021 when the course was particularly wet. Most other years have been dry, and the athletes dictated the speed of the course. The pandemic clearly affected the depth of the varsity race since 2021.
Last year, I made an adjustment to the projections for the reason that the sport was suffering a lack of depth since the pandemic. That proved to be wise, but I decided to make the assumption this year that we are back to "average" even though the data still points to lingering effects of low participation during the pandemic. Under the assumption that 2024 will be an average year, meaning that this year's middle tier "top 100" varsity high school runners are no better or worse than a typical year, I want my RED projected dots to land on the black AVG line as closely as possible. I cannot manipulate the curvature of the red dot curve. The curvature of the red dot curve is dictated by the ranking system. I can only move my red line up or down vertically to match the historical results profile of the county championship meet. I adjusted all times until I felt that I had the best overlay with the 12-year average. I aimed to line up the 20th to 40th ranked runners as closely as possible to the average line, paying little attention to the top ranked runners. Doing this exercise ensured that the projections are in line with the history of the meet on this course.
A quirk in the season calendar meant almost no ranked runners raced in the week before the Montgomery County Championship Meet (last week). It triggered the "Inactivity Rule" for several runners including three of the top five ranked boys. The inactivity rule states that runners lose fifteen points after THREE weeks inactive. After a fourth week inactive, athletes are removed from the ranking. I wanted to point that out since readers at home may not understand the drop of certain runners last week. Obviously, there is nothing scientific that says not racing for three weeks detracts X-number of seconds in a 5k. The rule is in place because three weeks of inactivity feels like an eternity in the ~11 week high school season. The ranking system needs check-ups and consistent runner comparisons. Unfortunately, there were almost no opportunities to race last week which has never been the case the week before the county championship meet. Missed races by top athletes certainly adds unpredictability to the quest for the individual and team titles this year.
 |
