|
Below you will find projected finish times for each of Mocorunning's ranked runners as of Week 6 (10/12/2025). Scroll to the bottom to read how the projected times were determined.
Boys Projected County Championship 5k Times
===========================================================================================
Pl 	Name                  	School                  Year           Projected Time	Pt
===========================================================================================
1	Dimitrios Rementelas	Sherwood		2028		16:03.2		1
2	Nathan Downie		Thomas S. Wootton	2026		16:08.2		2
3	Santiago Gutierrez	Winston Churchill	2026		16:12.1		3
4	Ayaan Ahmad		Clarksburg		2026		16:15.8		4
5	Henry Nichols		Northwood		2026		16:17.0		5
6	Zachary Oh		James H. Blake		2027		16:22.1		6
7	Ioannis Rementelas	Sherwood		2028		16:22.7		7
8	Michael Habib		Bethesda Chevy Chase	2026		16:22.8		8
9	Peter Lanpher		Bethesda Chevy Chase	2026		16:23.0		9
10	Patricio Pardo		Winston Churchill	2029		16:24.8		10
11	Daniel Skendaj		Bethesda Chevy Chase	2026		16:32.8		11
12	Zack Pritts		Walt Whitman		2026		16:34.3		12
13	Jonah Greszler		Walt Whitman		2027		16:35.5		13
14	Ian Fisher		Northwood		2028		16:37.6		14
15	Benjamin Burckle	Montgomery Blair	2026		16:39.1		15
16	Tobin Connelly		Bethesda Chevy Chase	2026		16:40.9		16
17	Bereket Eshetu		Northwood		2028		16:40.9		17
18	Alex Von Heideken	Bethesda Chevy Chase	2028		16:45.5		18
19	Benjamin Ploeger	Wheaton			2026		16:46.0		19
20	Evan Blenkinsop		Montgomery Blair	2026		16:47.8		20
21	Luke Gabrielle		Thomas S. Wootton	2026		16:48.4		21
22	Brandon Kneisler	Thomas S. Wootton	2028		16:51.2		22
23	John Taylor		Montgomery Blair	2026		16:53.5		23
24	Erich Ramos		Montgomery Blair	2026		16:54.9		24
25	Alec Mostofi		Bethesda Chevy Chase	2027		16:59.4		25
26	Garrett Simons		Poolesville		2026		17:03.9		26
27	Avery Smith		Sherwood		2028		17:05.2		27
28	Leonardo Bracciale	Bethesda Chevy Chase	2028		17:06.5		28
29	Donovan Hicks		Bethesda Chevy Chase	2026		17:07.1
30	Grant Levens		Walter Johnson		2026		17:07.5		29
31	Alex Zirkelbach		Sherwood		2028		17:10.2		30
32	Darly Philogene		Springbrook		2027		17:10.4		31
33	Aiden Liu		Montgomery Blair	2026		17:10.9		32
34	Jaylen Shah		Winston Churchill	2028		17:11.1		33
35	Lev Brener		Wheaton			2028		17:12.1		34
36	Ethan Dimmerling	Poolesville		2027		17:12.4		35
37	Zane Peterson		Albert Einstein		2026		17:14.6		36
38	Balin Savage		Montgomery Blair	2027		17:14.7		37
39	Maxwell Wolf		Walt Whitman		2026		17:15.7		38
40	Samuel Zhang		Winston Churchill	2027		17:16.0		39
41	Michael Armonda		Wheaton			2026		17:16.3		40
42	Satchel Jelen		Montgomery Blair	2026		17:17.4		41
43	Keaton Trouteaud	Poolesville		2026		17:19.0		42
44	Nathaniel Kaneshige	Northwest		2027		17:22.5		43
45	William Del Sole	Wheaton			2027		17:22.5		44
46	Evan Huang		Richard Montgomery	2027		17:25.8		45
47	Saaim Hamdani		Seneca Valley		2026		17:26.6		46
48	Stuart Mallon		Montgomery Blair	2026		17:26.8
49	Krish Sood		Winston Churchill	2028		17:27.0		47
50	Alex Daniels		Poolesville		2026		17:27.0		48
51	Braeden Taylor		Rockville		2027		17:27.7		49
52	Inder Haugen		Richard Montgomery	2027		17:29.1		50
53	Caleb Charmatz		Sherwood		2027		17:29.2		51
54	Cameron Wong		Rockville		2026		17:30.0		52
55	Ethan Stearns		Walt Whitman		2026		17:30.0		53
56	Luca Servis		Rockville		2026		17:31.2		54
57	Richard Harris		Northwest		2027		17:31.5		55
58	Dominic Billington	Winston Churchill	2028		17:33.2		56
59	Emiliano Dracoulis Vargas Walt Whitman		2029		17:34.1		57
60	Atreyu Kaine		Northwest		2029		17:34.8		58
61	Oliver Homan		Bethesda Chevy Chase	2026		17:35.4
62	James Edmonds-Moore	Albert Einstein		2028		17:35.4		59
63	Cruz Carbonell		Damascus		2029		17:36.0		60
64	Samuel Johnson		Walt Whitman		2028		17:37.8		61
65	Evan Hodge		Quince Orchard		2027		17:38.8		62

Projected Team Scores (Teams with 5+ ranked runners)
=================================================
   School                       Projected Points
=================================================
1. Bethesda Chevy Chase			62
2. Montgomery Blair			114
3. Sherwood				116
4. Winston Churchill			132
5. Walt Whitman				173

Teams with Four Ranked Runners: Poolesville, Wheaton
Teams with Three Ranked Runners: Northwest, Northwood, Rockville, Wootton
Mocorunning's ranking formula is explained HERE. The ranking formula is a system of point stealing. Points are stolen by finishing closer to or further ahead of other ranked runners compared to what is "expected." It is an interesting alternative to stagnant rankings of season best 5k times. Every race counts. Every race is an opportunity to perform better than expected relative to other ranked runners.
The projections you see on this page exactly match the names on the week 6 ranking published on 10/12/2025 with a couple notable changes. Private school runners were removed and the points were replaced with projected finish times for the county championship course at Gaithersburg. Do the points convert directly to 5k times? No, not exactly, but the points do convert to a time scale. 1 second = 2 points. Therefore, if the top ranked runner had 200 points, he or she would be ranked 200 points or 100 seconds above the ranking cutoff. You can assign that top ranked runner any 5k time, and he or she would be 100 seconds (1:40) above the ranking cutoff. Take any two runners and subtract their point totals, divide by two, and you will know how far apart they are expected to finish according to the ranking.
To assign the projected times to all the runners, you really only need to assign a projected time to one runner. Once one runner has an assigned projected time, the point scale dictates the finish times for every other runner within the ranking. It is not the first or last ranked runner that you want to key off of. It is the runners in the middle range that will be the most consistent year after year. The great thing about the county championship is that we have the same exact number of teams entered in the meet at the same time of the year, every year. The caliber of the middle tier varsity runners will not fluctuate very much from year to year.
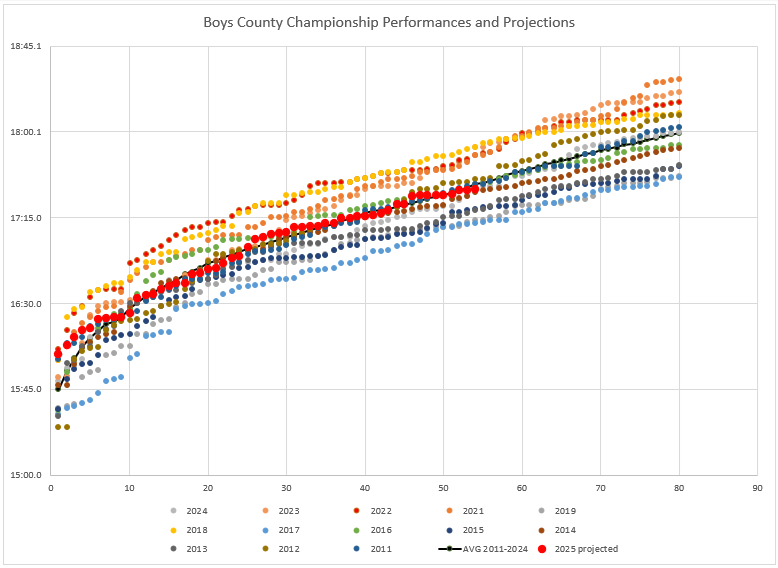
The chart below shows the county championship varsity race finishers plotted for each year since the course was modified in 2011. With twelve years of history on the course, the average line is well-defined. You can see that there have been some slow years (2018, 2021, 2022, 2023) and some very fast years (2015 and 2017). Weather played a roll in 2018 and 2021 when the course was particularly wet. Most other years have been dry, and the athletes dictated the speed of the course. The pandemic clearly affected the depth of the varsity race since 2021.
Last year, I decided to make the assumption that the boys we are back to "average." This proved correct. The boys of 2024 were generally in line or a few seconds faster than the historical average trendline. Under the assumption that 2025 will be an average year, meaning that this year's middle tier "top 100" varsity high school runners are no better or worse than a typical year, I want my RED projected dots to land on the black AVG line as closely as possible. I cannot manipulate the curvature of the red dot curve. The curvature of the red dot curve is dictated by the ranking system. I can only move my red line up or down vertically to match the historical results profile of the county championship meet. I adjusted all times until I felt that I had the best overlay with the 13-year average. I aimed to line up the 20th to 40th ranked runners as closely as possible to the average line, paying little attention to the top ranked runners. Doing this exercise ensured that the projections are in line with the history of the meet on this course.
 |