|
Below you will find projected finish times for each of Mocorunning's ranked runners as of Week 6 (10/12/2025). Scroll to the bottom to read how the projected times were determined.
Girls Projected County Championship 5k Times
===========================================================================================
Pl 	Name                  	School                  Year           Projected Time	Pt
===========================================================================================
1	Eleanor Finnegan	Thomas S. Wootton	2029		18:38.5	  	1
2	Madeline Quirion	Sherwood		2026		18:42.0	 	2
3	Audrey Wychulis		Northwest		2026		19:10.2	  	3
4	Olivia Donmoyer		Quince Orchard		2026		19:26.0	  	4
5	Alexia Ladstaetter	Bethesda Chevy Chase	2026		19:37.7		5
6	Madeline Kelly		Clarksburg		2027		19:38.1		6
7	Nya Stoian		Bethesda Chevy Chase	2027		19:40.2		7
8	Charlotte Chang		Thomas S. Wootton	2026		19:53.9		8
9	Korinne Austin		Winston Churchill	2026		20:03.7		9
10	Emily Wychulis		Northwest		2028		20:21.1		10
11	Margaret Sagan		Winston Churchill	2026		20:28.1		11
12	Divya Mudunuri		Northwest		2028		20:34.1		12
13	Adelaide Keller		Richard Montgomery	2027		20:34.9		13
14	Ava Summerfield		Bethesda Chevy Chase	2027		20:39.7		14
15	Lilah Rich		Bethesda Chevy Chase	2026		20:41.4		15
16	Adelaide Ryan		Gaithersburg		2027		20:41.5		16
17	Kinjal Kapoor		Walt Whitman		2028		20:42.1		17
18	Mariana Song		Bethesda Chevy Chase	2028		20:42.7		18
19	Marcela Mason-Rodriguez	Montgomery Blair	2027		20:51.6		19
20	Nadia Lund		Winston Churchill	2028		20:53.2		20
21	Anna McCrae		Poolesville		2026		20:55.6		21
22	Natalie McCarty		Walter Johnson		2028		20:56.0		22
23	Allie Hage		Bethesda Chevy Chase	2029		20:56.3		23
24	Olivia Dickerson	Thomas S. Wootton	2029		20:58.6		24
25	Emilia Pardo		Winston Churchill	2027		20:59.9		25
26	Noemi Keller		Richard Montgomery	2029		21:01.1		26
27	Samantha Polcawich	Magruder		2027		21:04.9		27
28	Ariana Arturo		Rockville		2026		21:06.8		28
29	Sifen Tusse		James H. Blake		2026		21:10.4		29
30	Ashley Polcawich	Magruder		2027		21:10.8		30
31	Emily Cornelius		Walt Whitman		2029		21:13.2		31
32	Bonita Eckford		Walt Whitman		2028		21:13.8		32
33	Aubrey Green		Bethesda Chevy Chase	2026		21:17.6		33
34	Era Ciobanu		Bethesda Chevy Chase	2028		21:18.6
35	Maya Grossman		Richard Montgomery	2027		21:21.9		34
36	Eliana Dolven-Miller	Bethesda Chevy Chase	2026		21:23.6
37	Leela Joshi		Albert Einstein		2027		21:30.1		35
38	Shreya Modur		Northwest		2026		21:31.0		36
39	Marguerite Mauldin	Montgomery Blair	2029		21:33.1		37
40	Lindsay Gallagher	Bethesda Chevy Chase	2028		21:33.4
41	Samantha Park		Winston Churchill	2026		21:33.5		38
42	Lucine Kanderian	Northwest		2028		21:34.2		39
43	Bhavya Chidambaranatha	Poolesville		2027		21:34.5		40
44	Morgan Braniff		Thomas S. Wootton	2029		21:35.5		41
45	Ruby Mercer		Poolesville		2026		21:36.0		42
46	Audrey Blake		Walter Johnson		2026		21:41.3		43
47	Paige Henry		Rockville		2026		21:42.5		44
48	Lucy Holland		Montgomery Blair	2026		21:42.9		45
49	Sadie Rice		Bethesda Chevy Chase	2027		21:43.1


Projected Team Scores (Teams with 5+ ranked runners)
=================================================
   School                       Projected Points
=================================================
1. Bethesda Chevy Chase			 59
2. Northwest				100
3. Winston Churchill			103

Teams with Four Ranked Runners: Wootton
Teams with Three Ranked Runners: Richard Montgomery, Whitman, Blair, Poolesville
Mocorunning's ranking formula is explained HERE. The ranking formula is a system of point stealing. Points are stolen by finishing closer to or further ahead of other ranked runners compared to what is "expected." It is an interesting alternative to stagnant rankings of season best 5k times. Every race counts. Every race is an opportunity to perform better than expected relative to other ranked runners.
The projections you see on this page exactly match the names on the week 6 ranking published on 10/12/2025 with a couple notable changes. Private school runners were removed and the points were replaced with projected finish times for the county championship course at Gaithersburg. Do the points convert directly to 5k times? No, not exactly, but the points do convert to a time scale. 1 second = 2 points. Therefore, if the top ranked runner had 200 points, he or she would be ranked 200 points or 100 seconds above the ranking cutoff. You can assign that top ranked runner any 5k time, and he or she would be 100 seconds (1:40) above the ranking cutoff. Take any two runners and subtract their point totals, divide by two, and you will know how far apart they are expected to finish according to the ranking.
To assign the projected times to all the runners, you really only need to assign a projected time to one runner. Once one runner has an assigned projected time, the point scale dictates the finish times for every other runner within the ranking. It is not the first or last ranked runner that you want to key off of. It is the runners in the middle range that will be the most consistent year after year. The great thing about the county championship is that we have the same exact number of teams entered in the meet at the same time of the year, every year. The caliber of the middle tier varsity runners will not fluctuate very much from year to year.
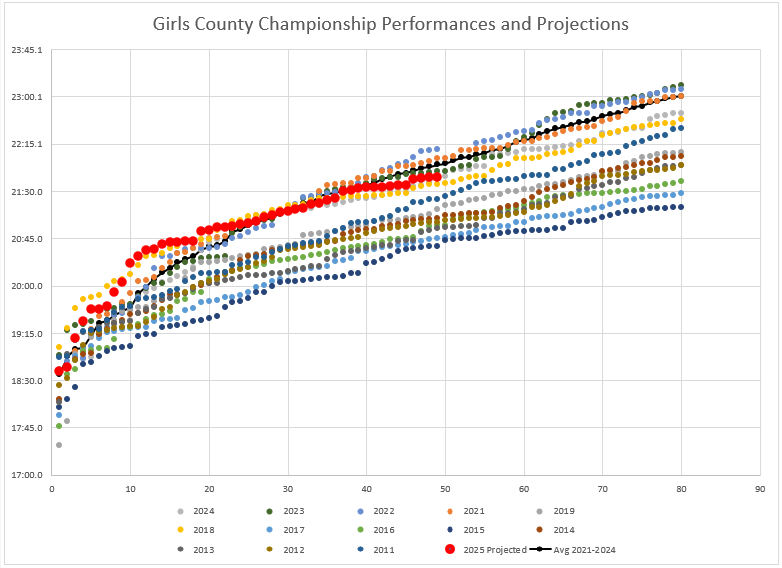
The chart below shows the county championship varsity race finishers plotted for each year since the course was modified in 2011. The pandemic clearly affected the depth of the varsity girls race since 2021. The black trend line is the average performance of runners from 2021 to 2024. Four of the "slowest" races in course history have been post-pandemic. This is not a knock of the kids working hard every day at the great sport of cross country. I just think the pandemic hit the reset button on the insane depth the county had built up over decades.
While the boys were a bit faster than the all-time course average last year, the girls were closer to the 2021-2024 average last year. Instead of calling 2025 an average year compared to the all-time course average, I have projected this year's girls to run in-line with the 2021-2024 average. I aimed to line up this years ranking with the 2021-2024 average trend line, paying particular attention to places 20 to 40.
|